
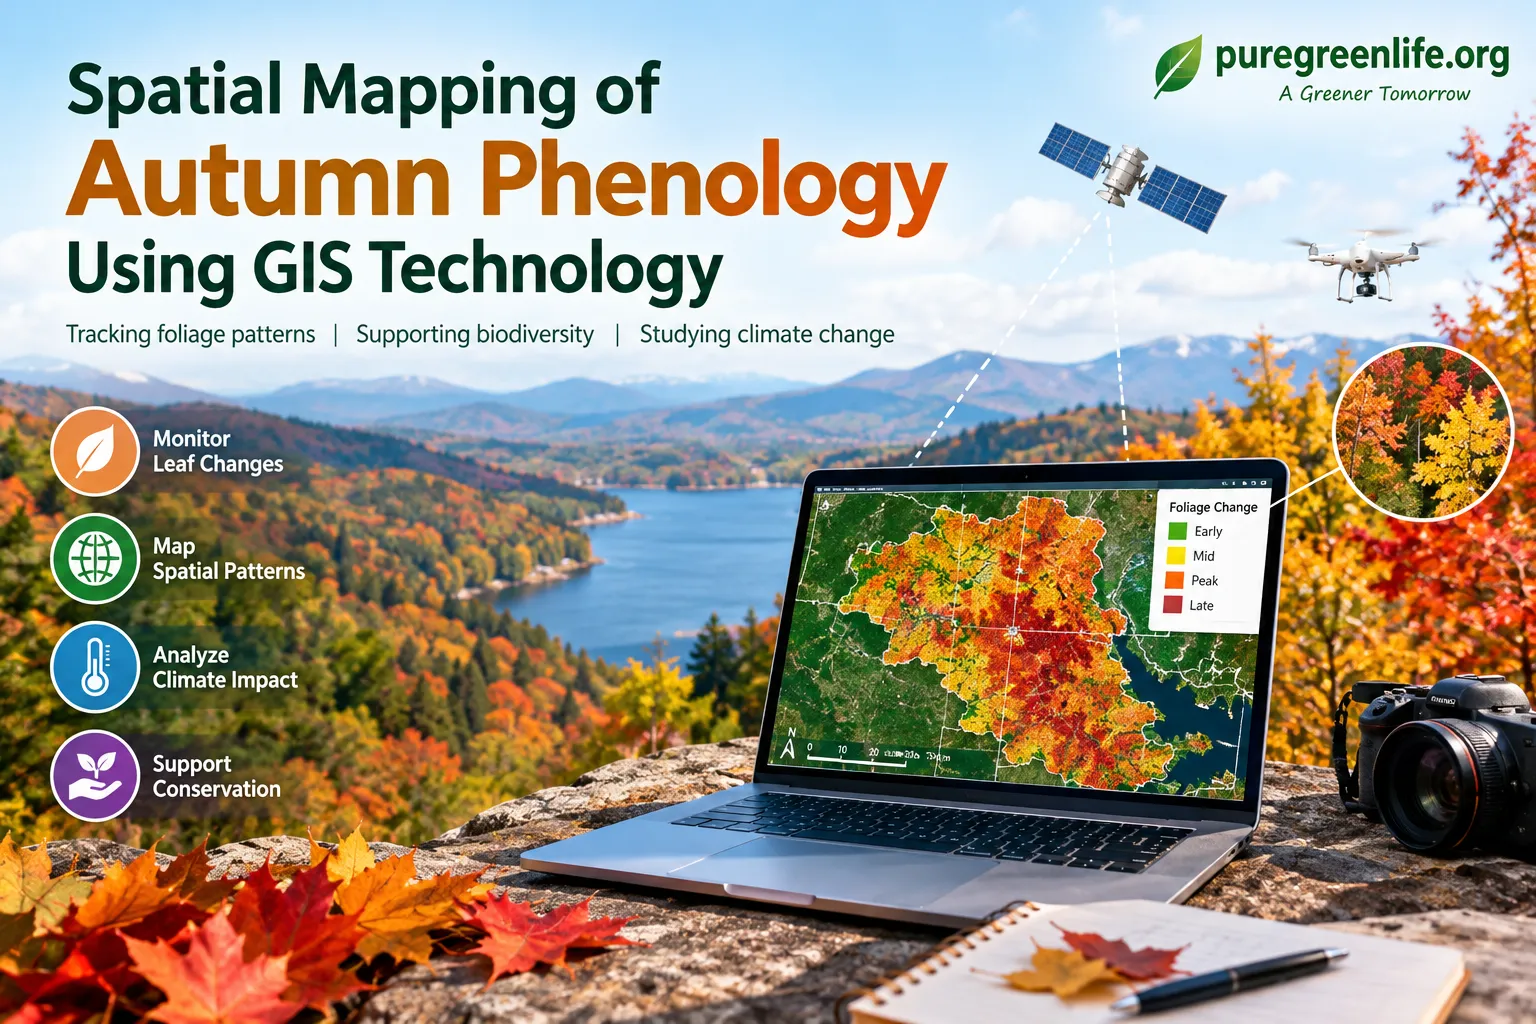
Spatial Mapping of Autumn Phenology Using GIS Technology
Autumn foliage offers more than beautiful colors. It also provides useful clues about plant health, seasonal cycles, and climate change. Scientists study these changes through a field called autumn phenology. With Geographic Information Systems (GIS), they can map when and where leaves change color or fall. As a result, researchers can compare patterns across landscapes and over time.
Introduction to Autumn Phenology
Definition and Significance
Autumn phenology studies seasonal changes in plants during fall. These changes include leaf color, leaf drop, and the timing of both events. They are influenced by temperature, daylight, rainfall, and local conditions. By tracking them, scientists can learn about forest health and changing ecosystems. These observations may also help researchers understand how wildlife responds to seasonal changes.
Historical Context of Foliage Studies
People have recorded seasonal changes in plants for centuries. Early naturalists wrote down when leaves changed color and when they fell. Later, researchers connected these observations with weather and other environmental conditions. Today, satellite images, digital maps, and long-term records make this work more detailed. Therefore, modern studies can compare current foliage patterns with observations from earlier years.
Why Spatial Mapping Matters
Understanding Ecological Patterns
Spatial mapping shows where foliage changes happen and how those changes vary by location. Researchers can compare forests, cities, mountains, and other landscapes. They can also compare foliage timing with temperature, rainfall, elevation, and land use. In this way, maps can reveal patterns that may be hard to notice in tables alone. These findings can support forest management and conservation planning.
Benefits of Spatial Analysis
GIS helps researchers combine information from different sources in one place. For example, they can compare satellite observations with local weather records. They can also identify areas where leaf color changes earlier or later than usual. In addition, maps make complex findings easier to share with communities and decision-makers. This information can guide future research and help protect important habitats.
GIS Technology and Its Applications
Overview of Geographic Information Systems
Geographic Information Systems, or GIS, are tools for collecting, managing, analyzing, and displaying location-based data. Researchers can layer several datasets on a single map. These may include vegetation, temperature, elevation, rainfall, and land cover. By comparing the layers, they can explore which conditions may affect autumn foliage. GIS therefore helps turn separate observations into a clearer view of environmental patterns.
Key GIS Tools and Software
Several tools support spatial mapping and environmental research. ArcGIS provides mapping and analysis features for many types of projects. QGIS is an open-source option that researchers can use without paying for a software license. Google Earth Engine supports analysis of large collections of satellite imagery. The best choice depends on the project, available data, budget, and the user’s experience.
Methods for Tracking Foliage Patterns
Data Collection Techniques
Researchers collect foliage data through both remote sensing and field observations. Satellites can capture changes across large areas over time. Drones may provide more detailed images of smaller locations, where permitted and suitable. Meanwhile, field researchers and citizen-science groups can record the timing of leaf color changes. Combining these sources can improve coverage and help researchers check whether mapped patterns match conditions on the ground.
Mapping and Analyzing Foliage Changes
After collecting data, researchers prepare it for comparison in GIS. They may map vegetation indices, observed color changes, or the dates when leaves begin to change. They can then compare maps from different dates or years. This approach helps identify trends, unusual changes, and differences between locations. However, researchers must account for cloud cover, image resolution, and differences in how observations were collected.
Case Studies and Practical Lessons
Regional Examples of GIS Applications
GIS can be used to study autumn foliage in many regions. For example, researchers may compare urban forests with nearby rural areas to investigate differences in seasonal timing. They may also map foliage changes across mountain slopes or across regions with different climates. Satellite imagery can show broad patterns, while local observations can add detail. The specific results depend on the location, time period, and data used.
Lessons from Case Studies
Successful studies often combine different types of evidence. Satellite images show large-scale patterns, while field observations help verify what is happening on the ground. Historical records can then show whether current changes differ from earlier seasons. Collaboration with local communities may also increase the amount of data available. Finally, researchers need flexible methods because weather, climate, and technology continue to change.
Analyzing Spatial Data and Foliage Trends
Statistical Methods
Statistical methods help researchers test patterns in foliage data. Regression analysis can explore relationships between foliage timing and factors such as temperature or rainfall. Time-series analysis can reveal changes across multiple seasons or years. Machine-learning methods may also help identify patterns in large datasets. Still, predictions depend on data quality and should be checked against independent observations.
Visualizing Trends with Maps
Maps make results easier to interpret. Heat maps can highlight areas with similar foliage timing, while time-based maps can show how changes spread across a region. Three-dimensional maps may help researchers examine patterns across different elevations. In addition, clear legends, labels, and dates help readers understand what each map shows. Good visual design is important because it reduces the risk of misreading the results.
Effects on Ecology and Climate Change
Impact on Biodiversity
The timing of leaf color change and leaf drop can affect ecosystems. For example, falling leaves provide food and shelter for some organisms. Seasonal changes may also influence the availability of food for insects and other wildlife. If plants and animals respond to seasonal cues at different times, their interactions may be disrupted. Therefore, tracking phenology can help scientists investigate changes in biodiversity and food webs.
Responses to Climate Variability
Temperature and rainfall patterns influence the timing of autumn foliage. When these conditions change, leaves may change color earlier or later than expected. The size and direction of these shifts can vary by species and location. GIS helps researchers compare these differences across broad areas. Over time, the results can improve understanding of how ecosystems respond to climate variability.
Future Directions in GIS-Based Research
Emerging Technologies
New technology is expanding the ways researchers track foliage. Higher-resolution satellite imagery can provide more detailed observations. Drones can support local surveys, while automated image analysis can help process large datasets. In some projects, interactive maps may also make results easier for the public to explore. Even so, researchers must consider cost, data quality, privacy, and local rules when choosing tools.
Collaborative Research Opportunities
Autumn phenology research benefits from cooperation among scientists, universities, local agencies, and community groups. Citizen-science projects can invite people to report leaf changes in their areas. Researchers can then compare those reports with satellite data and weather records. This collaboration may improve coverage and increase public understanding of seasonal change. Clear guidance and consistent observation methods help make the resulting data more useful.
Conclusion
GIS-based mapping provides a practical way to study autumn phenology across different landscapes. By combining satellite imagery, field observations, weather records, and statistical analysis, researchers can track seasonal changes more clearly. These patterns can help explain links between foliage, biodiversity, and climate variability. Although data limitations remain, continued improvements in GIS and collaboration can strengthen future research.
Frequently Asked Questions
What Is Autumn Phenology?
Autumn phenology is the study of seasonal changes in plants during fall. It includes the timing of leaf color changes and leaf drop.
How Does GIS Help Study Autumn Phenology?
GIS combines location-based data and displays it on maps. Researchers can use it to compare foliage patterns with weather, elevation, vegetation, and land use.
What Are the Benefits of Tracking Foliage Patterns?
Tracking foliage patterns helps researchers study forest health, seasonal cycles, and possible climate impacts. It can also support biodiversity research and conservation planning.
Can GIS-Based Phenology Tracking Be Used Globally?
Yes. Researchers can use GIS in many regions and ecosystems. However, the quality of comparisons depends on available imagery, local observations, and consistent methods.